In the Prairie Coteau (or Coteau des Prairies) of South Dakota there are thousands of small marshy ponds - veritable islands in a sea of prairie grasses. There are ponds of many sizes, tiny puddles to large lakes, but I’m interested in peering into a few of the small marshy ponds. Get off the main road and you can take a drive through this elevated plain (the Coteau is an approximately 300 by 150 km plateau that sticks up over a hundred meters from the surrounding prairie) passing pond after pond that all look very similar.
Lets take a peak at four ponds, all in the same generally area (one can drive and visit them all within a half hour). Each pond houses four species of freshwater snail - but among all the ponds there are seven species. Species #1 and #2 are found in all ponds - not coincidently the most abundant species in the state. The third species is in three ponds, the fourth species is in two ponds and rest of the species are each observed in just a single pond.
These ponds, appear, on more than just a brief inspection, to be very similar. They are about the same size, they are in the same region, they have a similar array of shoreline vegetation, but they do not have the same species of freshwater snail. Why do they not have the same array of species? Or, asking another way, why do they have such similar species? The common species are found throughout the state and could be expected to show up in nearly every pond. Species that prefer small marshy pond habitats should be found in - yes, you guessed it - small marshy ponds (go figure).
The interesting aspect, in my view, are the less common snails. Why are they where they are? Why are they not in each of the ponds? If they do well in small marshy ponds why are they not found in all of the small marshy ponds or even most?
Jared Diamond thought about these type of questions when examining the birds of islands (in the New Guinea archipelago). He wondered if the presence of one species was inhibited by competition with another species and came up with a method to test for species pairs not being found together. Species not found together (on the same island in this case) were termed checkerboard species (found on black squares of a checkerboard but not white squares). If species are indicated to be distributed in a checkerboard pattern then it is possible that competition between the two species explains their distribution pattern. Its also possible that other forces are at play, but lets not get too far away from the story :-)
Is this pattern - checkerboard species - evident among freshwater snails?
Three values, 1. actually number of checkerboard species, 2. an average of the number of checkerboard species, (called the C-score), and 3. The number of unique species combinations, may indicate competition. Each indices is compared to a model of random distribution of species - Competition is indicated if the the observed value of checkerboard species and C-scores is greater than, AND the unique species combinations is less than, the model.
Here is the results table for freshwater snails - not just the few ponds listed above but among 268 water bodies of Nebraska and South Dakota.
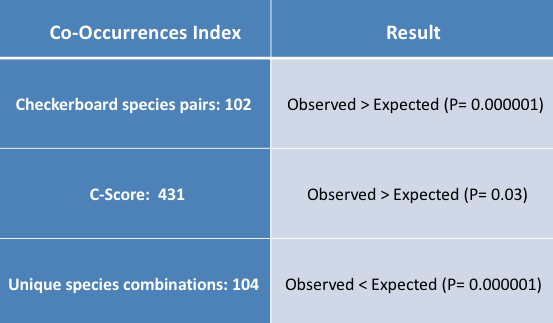
Indications are that competition influences the array of species in a water body. The array of freshwater snail species is no doubt influenced by other factor as well, such as preferred habitat and life history traits.
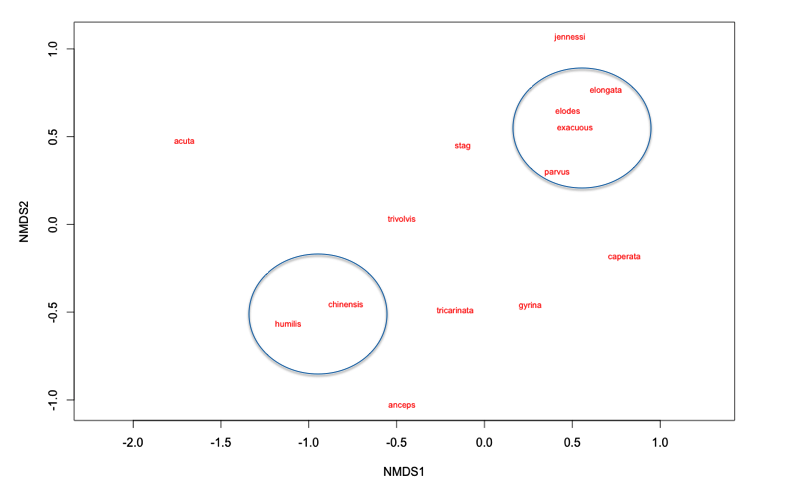
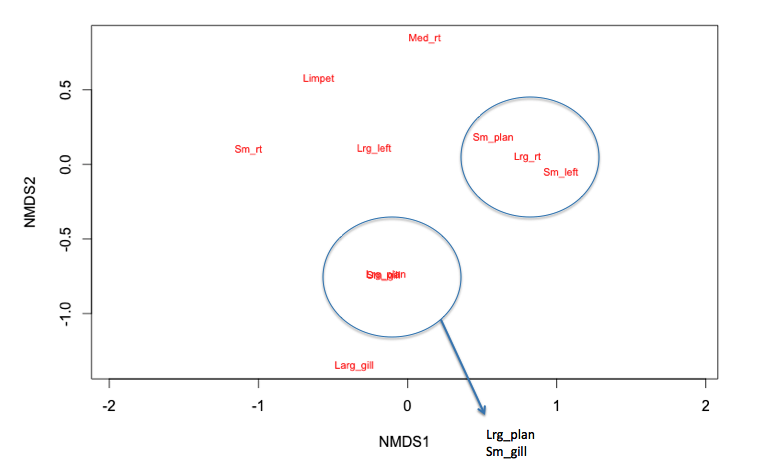
Species that co-occur somewhat of the opposite of checkerboard species) might be indicated by a somewhat messy multivariate method called non-metric multidimensional scaling (NMS). Species found together will tend to cluster together in a graphical representation.
Here are two NMS graphs - one using species (Top) and one using shapes of snails (Bottom): I have circled species (or shapes) that seems to me to cluster together.
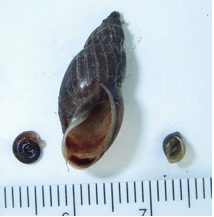
Here are three species from a Nebraska wetland, showing three species of different shapes and sizes.
If species are not competing but are beneficial to each other, or prefer the same habitat, then we predict they would be found together - this may show up as unique species combinations in the checkerboard table above or in clusters.
Summary of sorts in science speak:
Species distribution patterns - what they mean, how to analysis them, etc - is a controversial subject; interested in jumping into the subject? Listed below are some to start with (this is just s few of a huge array of literature on and using these methods):
Diamond, JM. 1973. Distributional ecology of New Guinea birds. Science 179: 759-769.
Edward FC, MD. Collins, and D Simberloff. 2013. The Chequered History of Checkerboard Distributions. Ecology. http://dx.doi.org/10.1890/12-1471.1.
Gotelli, N. 2016. Checkerboards and missing species combinations: Are ecological communities assembled by chance? Chance 29: 38-45.
Summary of sorts in science speak:
- Species C-scores, checkerboard scores, and unique species combinations show significant deviation from random (Null) models (P<0.05), suggesting competition influences species assemblages.
- Species co-occurrences suggest some species aggregate, perhaps due to site conditions (habitat type). Circled ‘clusters’ are from sails that are known to be observed primarily in reservoir ( one cluster) and marshes (another cluster).
- Morphological co-occurrence, suggest different morphs co-occur, perhaps due to competition between similar snails.
Species distribution patterns - what they mean, how to analysis them, etc - is a controversial subject; interested in jumping into the subject? Listed below are some to start with (this is just s few of a huge array of literature on and using these methods):
Diamond, JM. 1973. Distributional ecology of New Guinea birds. Science 179: 759-769.
Edward FC, MD. Collins, and D Simberloff. 2013. The Chequered History of Checkerboard Distributions. Ecology. http://dx.doi.org/10.1890/12-1471.1.
Gotelli, N. 2016. Checkerboards and missing species combinations: Are ecological communities assembled by chance? Chance 29: 38-45.
 RSS Feed